Most small operators run their business from memory and a cash box. Kadaikodi hands them a dashboard instead.
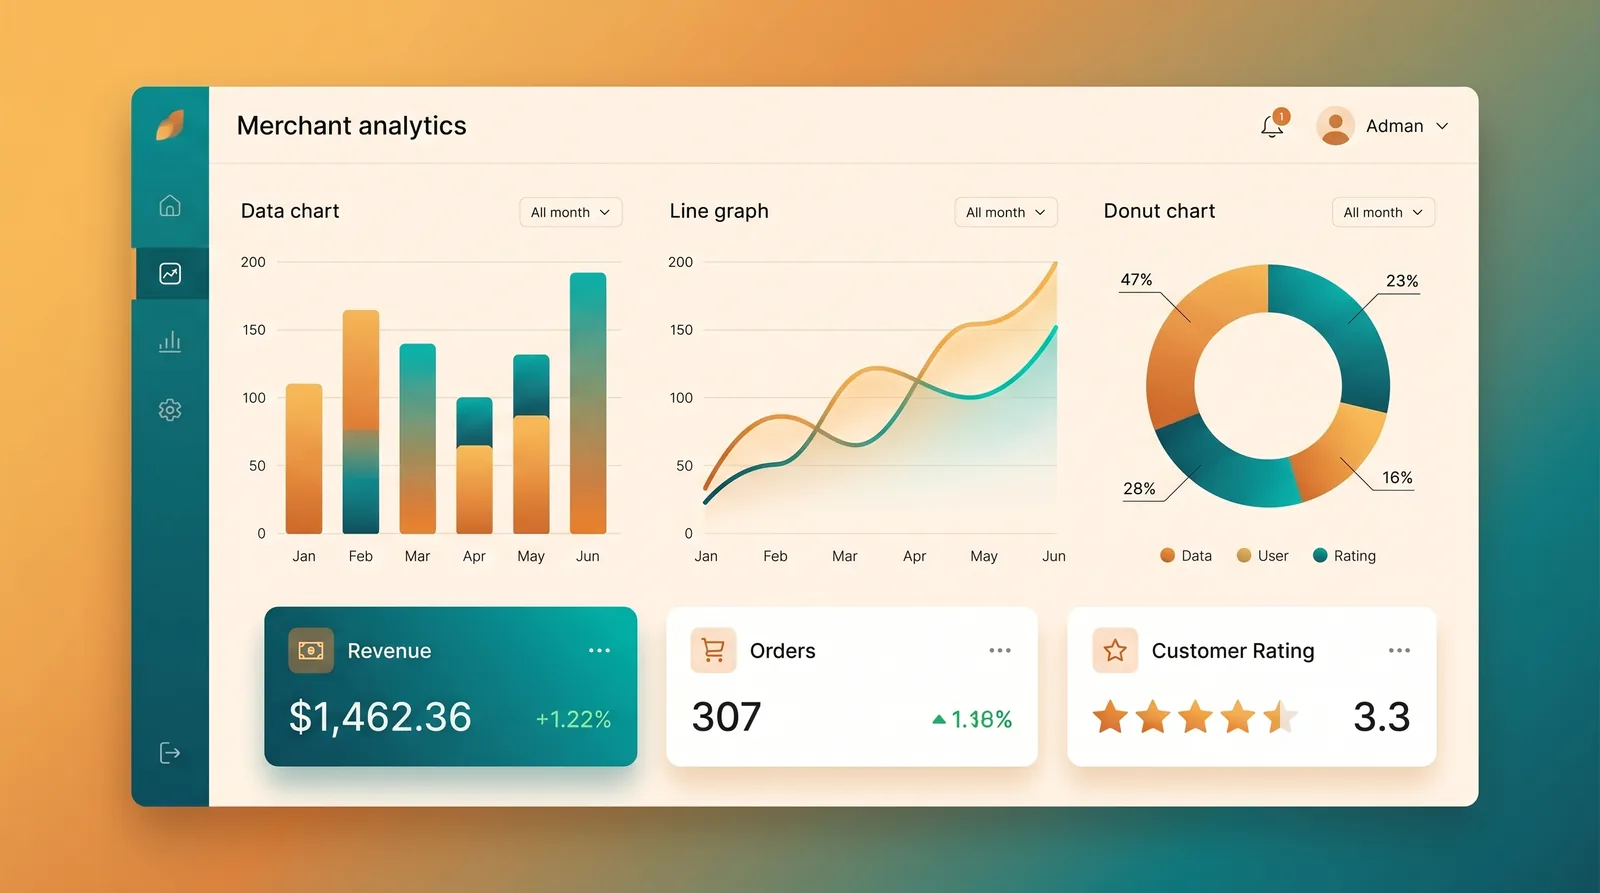
A merchant can see total revenue, total and pending orders, average order value, how many active customers they have, and their average rating — the handful of numbers that actually tell them how the business is doing. That turns gut-feel decisions (“should I prep more in the evening?”) into data-backed ones.
It’s the same analytics surface that, at scale, lets enterprise operators compare merchants across a fleet.
Illustrative scenario — describing the analytics, not real business data.
Illustrative workflow outline
Run the business on data — revenue, orders, performance metrics, and customers — across any time range, then export it.
This outline is not proof that a workflow completed. Actual availability and outcomes depend on your role, workspace configuration, and the service at the time you use it.
From the dashboard, open Analytics.
You should see: The Analytics Dashboard opens with your revenue overview.
Ready to make this your story?