
Sales Analytics and Demand Outlook
Revenue, orders, top sellers and peak hours from a merchant's own orders, plus a look ahead at the next busy stretch.
These images are illustrations of the concept, not screenshots of the actual product.
Overview
Many small merchants run on instinct: they know the weekend is busy and that a favorite dish sells out, but not by how much or at what hour. This concept shows how the Kadaikodi merchant console could turn a cart's own order history into answers, first as a clear sales report and then as a forward look that suggests how much to prepare.
The first illustration presents the Analytics page with a date-range selector and a removable filter chip. Four KPI cards show total revenue, orders, average order value and the share of repeat customers, each with a change indicator. Below, a donut chart splits revenue by category with the total in the center, an area chart plots daily order trends with a hover tooltip, and a Top Selling Items panel ranks offerings by order count. Each panel has its own menu, filter and refresh controls.
The second illustration places the same analytics inside the unified, role-aware console in a dark theme, where the sidebar groups destinations by customer, cart owner, worker, investor and admin roles. A merchant picker and Today, This Week, This Month and This Year tabs sit beside an Export button. Alongside revenue, orders and average order value it adds an acceptance rate, a thirty-day daily orders chart, top-selling offerings with units, revenue and share, a least-selling panel, a peak-hours strip and a peak-days card. A footnote stresses that the figures are meant to be computed from the merchant's live orders; the numbers in the illustration are samples.
The third illustration, Demand outlook, is labeled as a preview that draws only on historical analytics. A next-12-hours chart shows recent hourly orders followed by projected bars inside a shaded range, with the likely peak flagged. A Why this forecast panel lists the signals behind it, and a Suggested prep table compares stock on hand with a suggested quantity and a confidence level, each with an Add to prep list button, above a staffing note for the busy window.
What this concept shows
- KPI cards for revenue, orders, average order value, repeat customers and acceptance rate
- Revenue by category donut chart with the period total in the center
- Daily order trend charts with hover tooltips
- Top-selling and least-selling offerings with units, revenue and share
- Peak-hours strip and peak-days card showing when the cart is busiest
- Period tabs, a date-range filter and an Export button
- Next-12-hours demand outlook with a flagged likely peak and the reasons behind it
- Suggested prep table with confidence levels and Add to prep list actions
How it works
- Open Analytics from the merchant console and choose a period such as This Month.
- Read the KPI cards to compare revenue, orders and average order value with the previous period.
- Use revenue by category and the top-selling offerings to see what drives sales.
- Check peak hours and peak days to plan staffing and preparation.
- Open the Demand sub-page to see the next 12 hours and the signals behind the outlook.
- Add suggested quantities to the prep list and review the staffing note for the peak window.
- Export the figures when they are needed outside the console.
Who it's for
- Cart and shop owners
- Kitchen leads planning daily prep
- Store managers scheduling staff
- Marketplace operators supporting merchant growth
Illustrations
3 illustrations of this concept. Select one to view it full size.
Analytics: Revenue, Orders and Top Sellers
This illustration shows the Analytics page of the merchant console inside a desktop browser window. The sidebar, labeled Merchant Console, lists Dashboard, Orders, Products, Customers, Analytics, Marketing and Settings, with Analytics active. A This Month dropdown and a removable date-range filter chip sit at the top right. Four KPI cards show total revenue with a change against last month, total orders, average order value and the percentage of repeat customers, each with a small upward change figure. Below, three panels share menu, filter and refresh buttons: Revenue by Category, a donut chart with the period total at its center and a legend splitting sample revenue between food and beverage, grocery and fashion; Order Trends, an area chart across the days of the month with a hover tooltip; and Top Selling Items, horizontal bars ranking sample dishes and a saree by order count.
Analytics From Live Orders, With Peak Hours
This illustration shows merchant analytics inside the unified console in a dark theme. The left sidebar groups destinations by role (Main, Customer, Cart Owner, Worker, Investor, Admin and System), and a top bar holds a neighborhood location selector, a search box for merchants, orders and offerings, notifications and an avatar. A breadcrumb reads Merchant / Analytics beside a picker for the merchant being viewed, with Today, This Week, This Month and This Year tabs and an Export button. KPI tiles report revenue with its change against last month, orders, average order value and acceptance rate. Panels show daily orders for the last 30 days as an area chart, revenue by category as a donut, a table of top-selling offerings with category, units, revenue and share, a partly visible least-selling panel, a shaded peak-hours strip from morning to night, and a peak-days card. A footnote says the figures come from the merchant's live orders; the values shown are illustrative.
Demand Outlook With Suggested Prep
This illustration shows the Demand sub-page of merchant analytics, reached through a Merchant / Analytics / Demand breadcrumb, with a merchant chip and a Period selector set to This Week. The Demand outlook heading carries a preview badge, and a dismissible banner explains that the view uses the merchant's historical analytics only. A Next 12 hours chart shows solid bars for recent hours, then dashed, projected bars inside a shaded range, with one bar tagged Likely peak. A Why this forecast panel lists three example signals with small sparklines: the average for the same weekday and hour over recent weeks, a dish that sold out at that time twice, and rain typically shifting dine-in orders to delivery. A Suggested prep table lists offerings with on-hand quantity, suggested prep and a High, Medium or Low confidence, each with an Add to prep list button, above a roster note suggesting one more person on shift.
Topics
- merchant sales analytics
- revenue by category chart
- top selling items report
- peak hours analysis
- demand forecast for small business
- food prep planning
- order trends dashboard
- repeat customer rate
- restaurant sales dashboard
- daily demand outlook
Related concepts
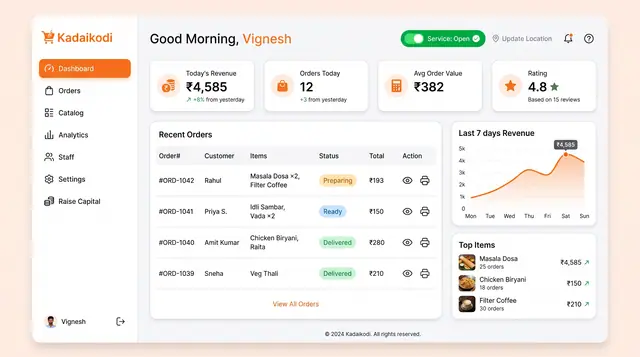
Merchant Dashboard and Order Lifecycle
See the day's revenue, orders and rating, open the storefront, and move each order from new to dispatched.
2 illustrations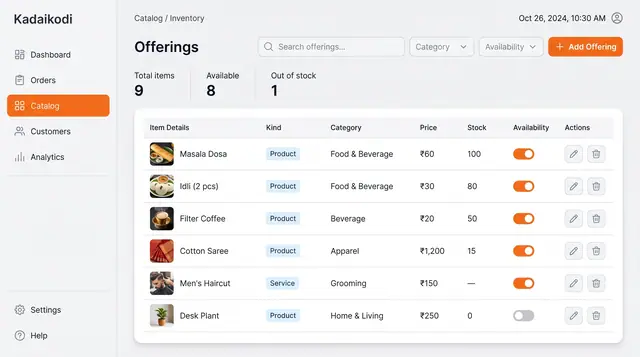
Catalog and Inventory Management
Manage products and bookable services in one table, with price, stock and an availability switch for each.
1 illustration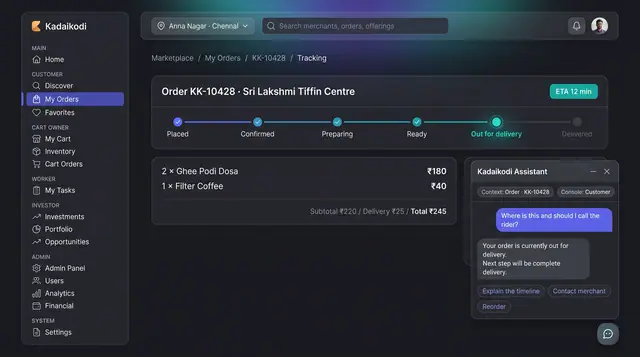
In-Context Assistant and Daily Proposals
An assistant that already knows which order you are looking at, and a daily queue of suggested changes you accept, edit or dismiss.
2 illustrations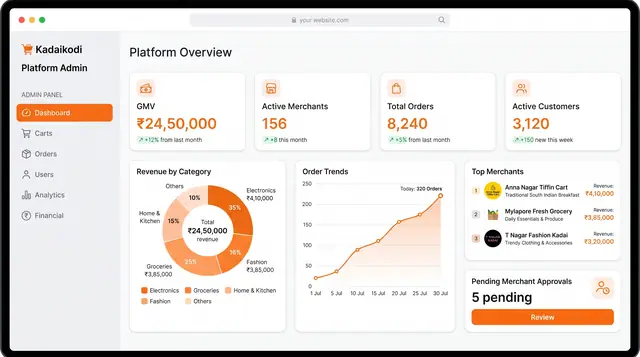
Platform Operations and Analytics
An operator's view of the whole marketplace: GMV, merchants, orders, customers, take rate and category mix across two linked screens.
2 illustrations